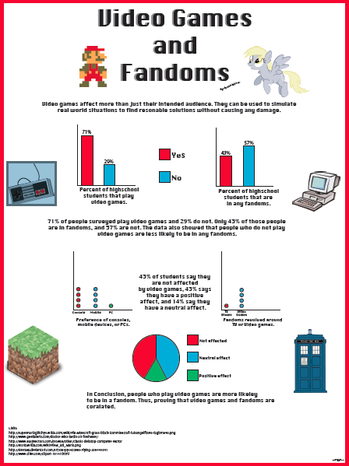
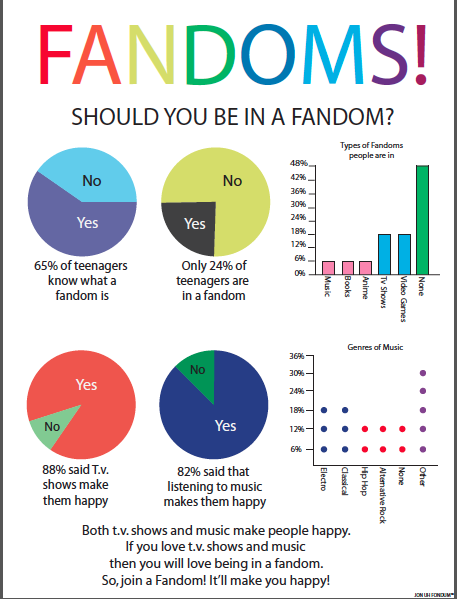
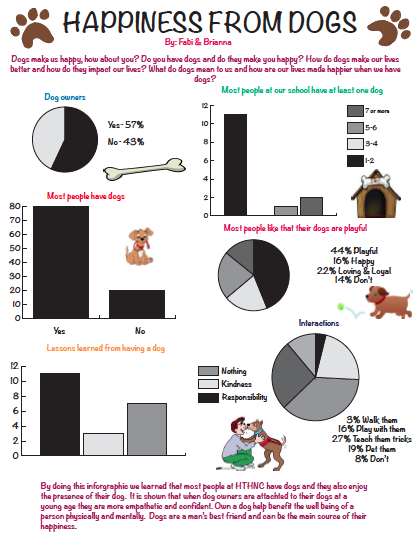
What Makes Us Happy? -- The Infographic
Standards
Essential Questions:
Description and Product:
This project will span three different classes: Humanities, Math, and Multimedia. In Humanities, students have the opportunity to explore the things that make them happiest in life. In math, their task is to gather data to discover if other students at HTHNC have common interests. Students will create surveys composed of questions that generate reliable data, analyze the data, and then communicate their findings in the form of an Infographic. A draft of the Infographic will be hand-drawn, and the final Infographic will be created on Adobe Illustrator in Multimedia.
Student will encounter the following topics to support this project:
Students' Creations:
- Represent data with plots on the real number line (dot plots, histograms, and box plots).
- Use statistics appropriate to the shape of the data distribution to compare center (median, mean) and spread (interquartile range, standard deviation) of two or more different data sets.
- Interpret differences in shape, center, and spread in the context of the data sets, accounting for possible effects of extreme data points (outliers).
- Attend to precision.
Essential Questions:
- How can we visually represent data?
- How does the way we visually represent data affect people’s interpretation of the data?
- How does the way we collect data affect the outcome of a study?
Description and Product:
This project will span three different classes: Humanities, Math, and Multimedia. In Humanities, students have the opportunity to explore the things that make them happiest in life. In math, their task is to gather data to discover if other students at HTHNC have common interests. Students will create surveys composed of questions that generate reliable data, analyze the data, and then communicate their findings in the form of an Infographic. A draft of the Infographic will be hand-drawn, and the final Infographic will be created on Adobe Illustrator in Multimedia.
Student will encounter the following topics to support this project:
- different single variable graphs, including box plots, histograms, and frequency charts, and when each is the best to use
- writing survey questions
- visually representing data
- things to consider when displaying data
- what makes a "good" infographic
Students' Creations:
|
|
|
